What Optrak does
Analytics and Strategic Planning
Optrak keeps every plan you run, so cost and CO₂ can be broken down by customer and route over any period. Bigger decisions — a different fleet, a new depot, a contract you are bidding for — are tested by planning the changed operation with the same optimiser and comparing the two plans.
Last updated: 2026-10-28
Every plan Optrak builds is kept: what went in, what came out, and what it cost. That record answers the everyday questions, such as which customers cost most to serve, or how much of each lorry’s capacity was used last month. It is also the starting point for the big decisions.
For those, Optrak plans the operation you are thinking of moving to with the same optimiser that plans today’s work. Change the fleet, move the depot or add the contract, plan it again, and put the two plans side by side.
Every Plan You Run, Kept
The data warehouse holds every plan the operation has run. Each one is kept with the orders, vehicles and sites it was planned from, the routes it produced, and its totals: cost to serve, CO₂, how full the vehicles were, driver hours, and any work that could not be fitted in. Nothing is overwritten, so after a year you have a year of plans to look back over.
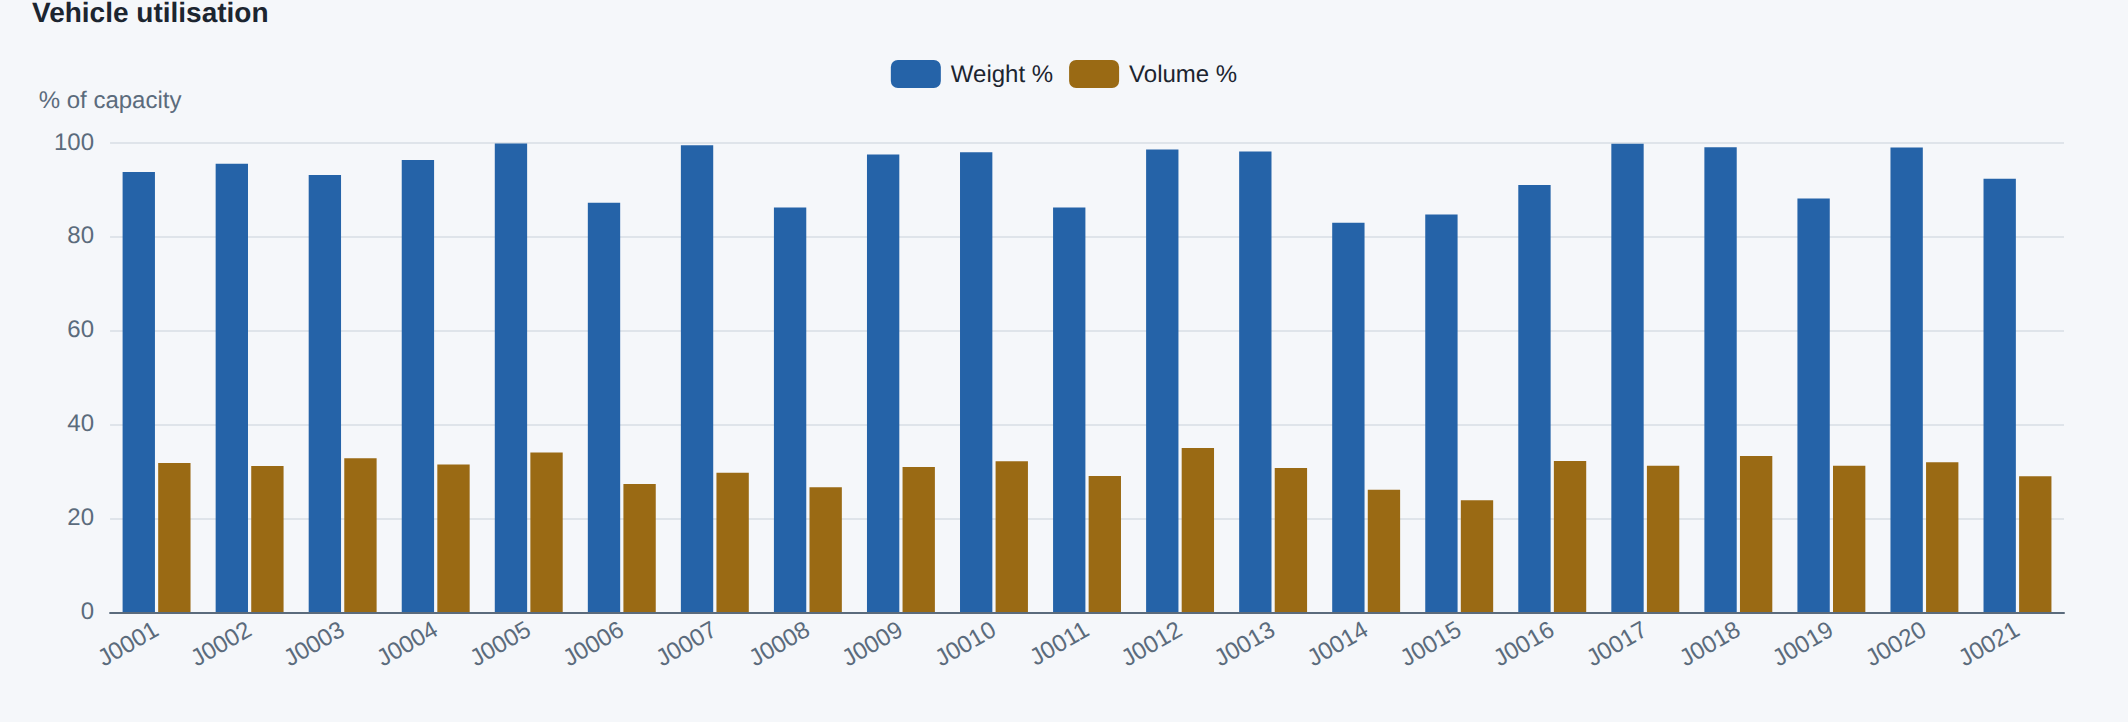
Every journey in one plan, by how much of the lorry’s weight limit (blue) and space (brown) its load uses. All 21 reach 83% or more of the weight limit while filling only 24% to 35% of the space.
You get at it through the Strategic Workbench, which gives summaries across plans and tables you can pivot, with no SQL. If you would rather analyse it in your own tools, a copy of the database can be supplied on request.
A commercial manager who suspects some customers are served at a loss can pivot the last quarter’s plans by customer, with cost to serve against number of drops, and sort the result. The customers whose cost runs well ahead of their volume come to the top. None of it needed new data collecting; it was already in the plans.
Testing a Decision Before You Make It
A strategic question is answered the same way whatever it is about. Copy the live operation, change the one thing the decision turns on, plan it again, and compare the result with today’s plan. The questions operators bring to it are mostly these:
- A different fleet, including how much of it could be electric, and which rounds would need a charging stop.
- New business. What a contract would cost to fit into the operation you already run, which is the number a bid should be priced on.
- Moving or adding a depot, compared on cost and CO₂ against where you are now.
- Shift patterns and delivery windows. Five days against six, double-shifting, or what a tighter window for a customer would cost to honour.
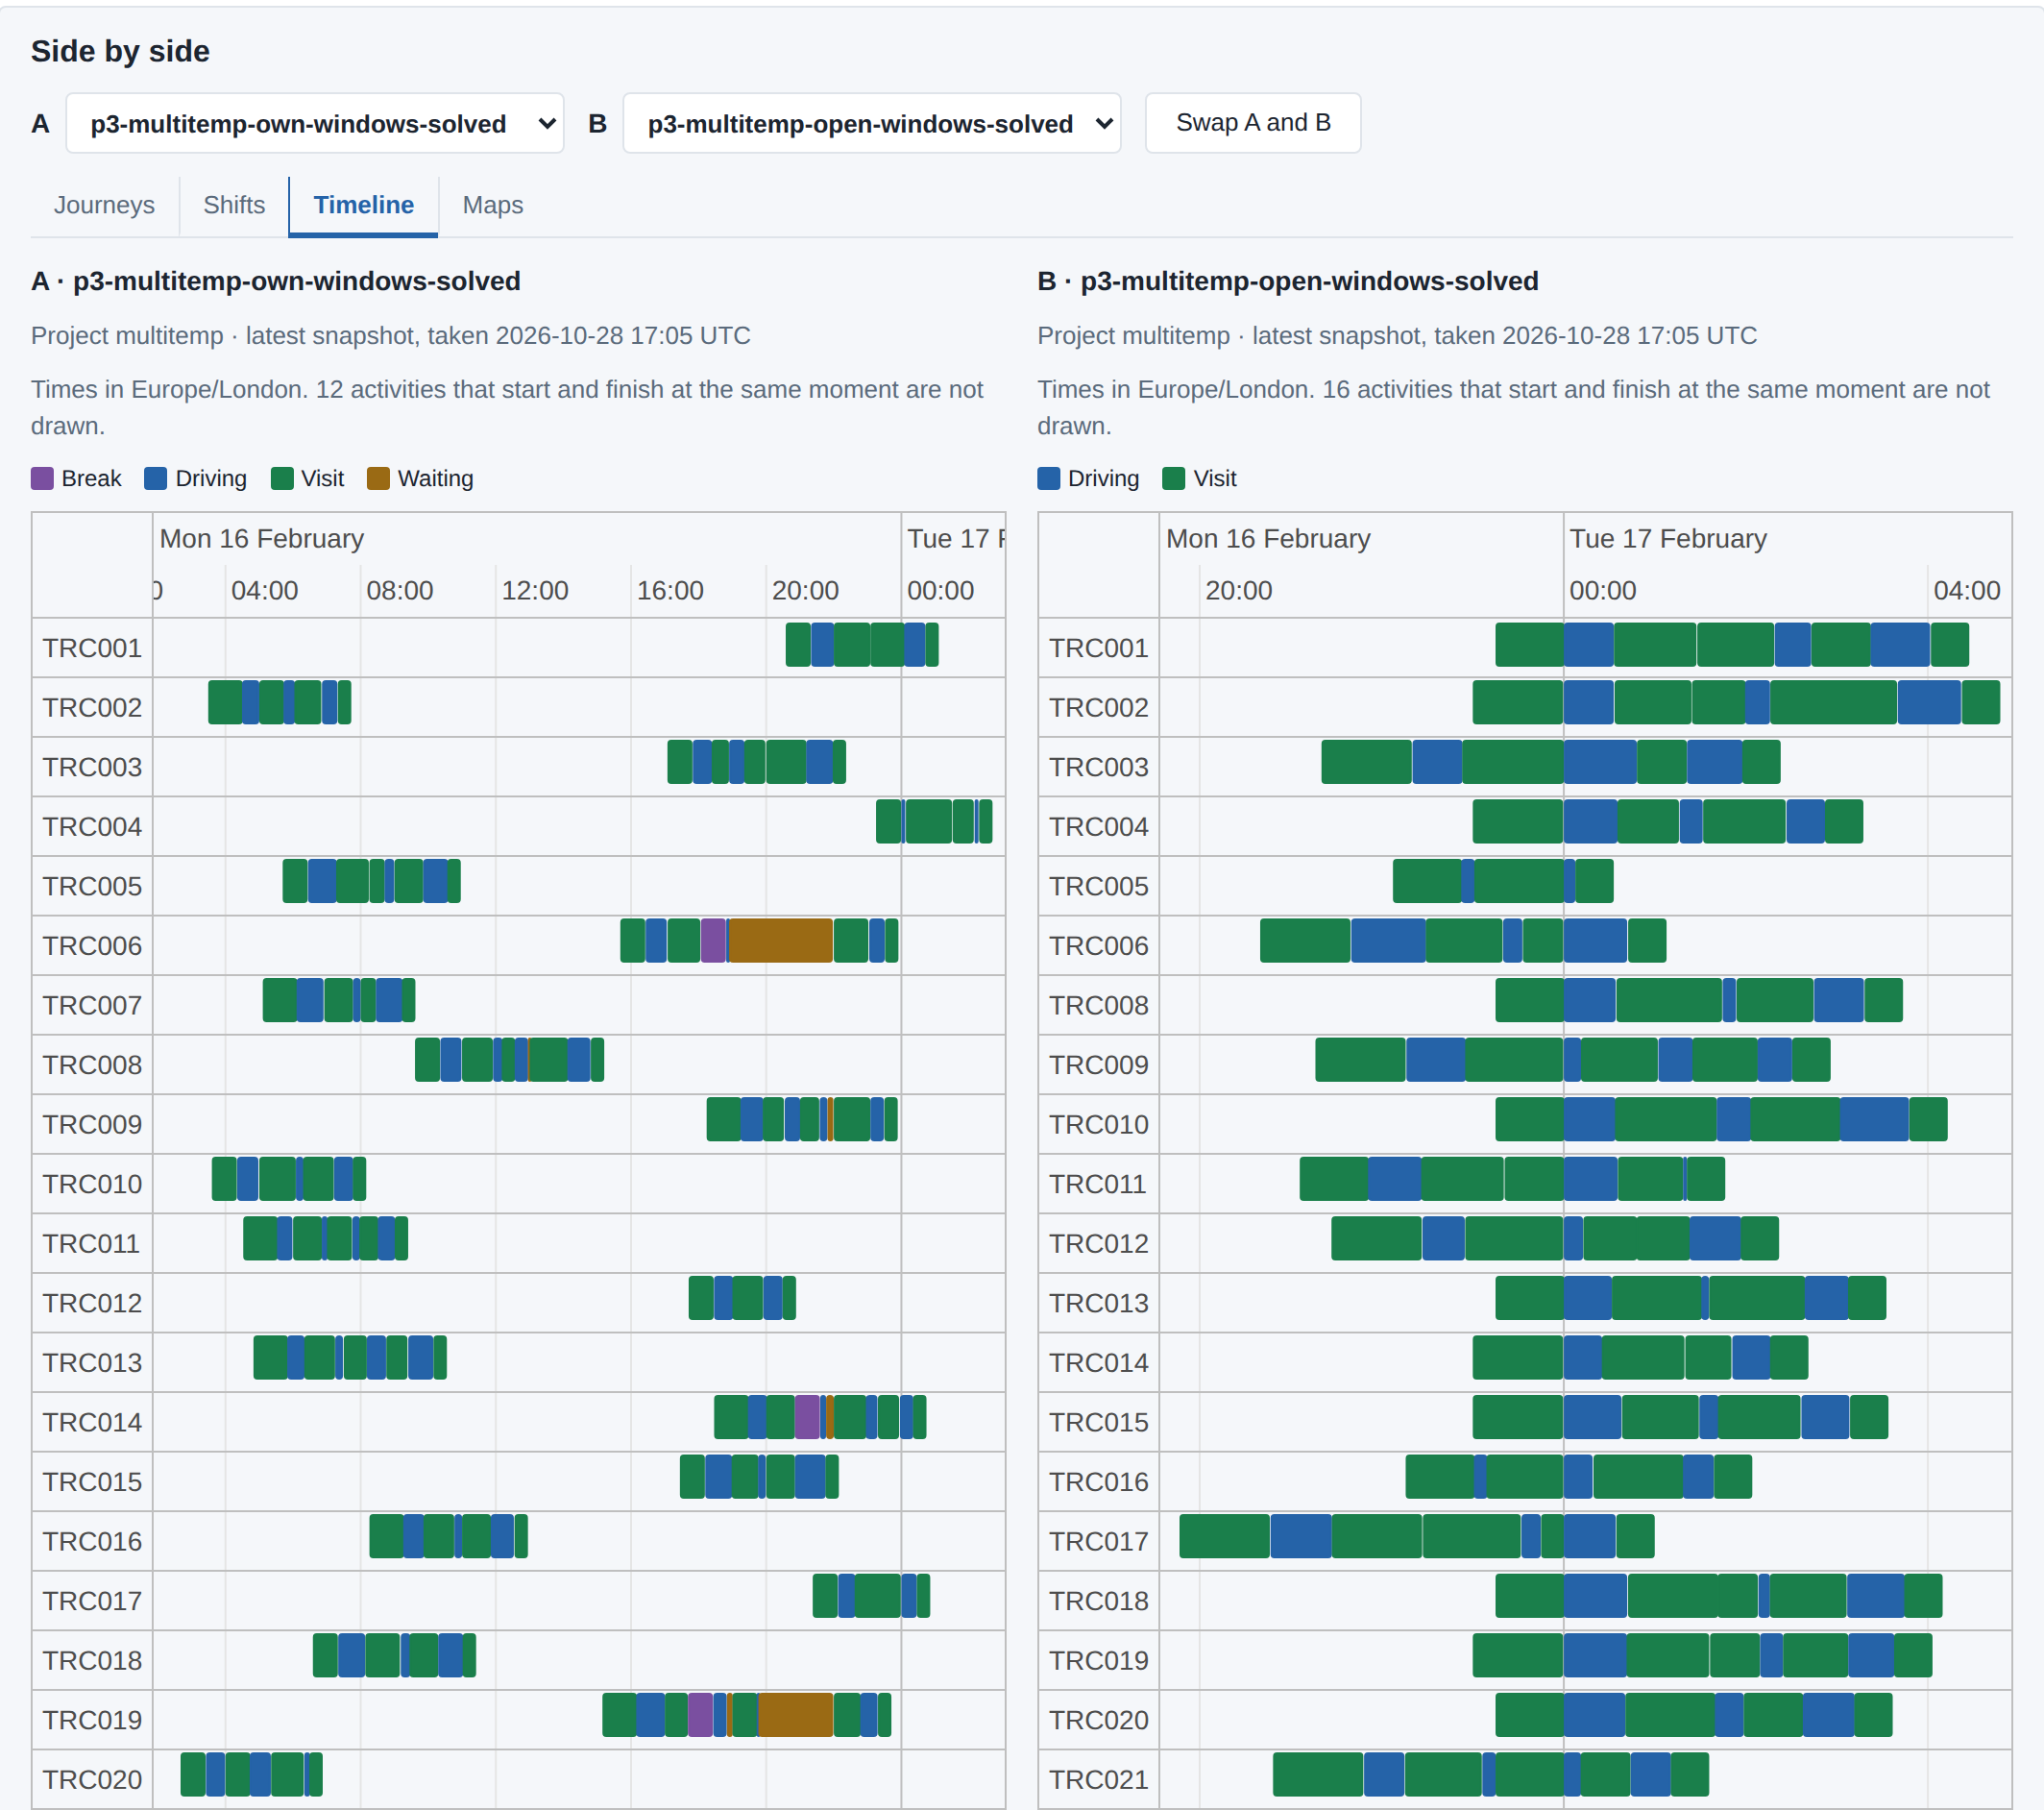
The same 208 orders planned twice, side by side, with the first twenty lorries of each plan shown. Each row is one lorry’s day: blue is driving, green is time at a stop, brown is waiting and purple is a break. On the left, every customer keeps its own delivery window. The 41 lorries go out at any time from 02:26 to 23:15, and 13 of them wait for a window to open, 21 hours in all. On the right, every window is opened to the whole planning day, 03:00 on Monday to 05:00 on Tuesday, and all 40 lorries go out between 19:46 and 23:15 and are back by 04:47, with no waiting. The two sides are drawn to different scales: the left covers all of Monday, the right only Monday evening and the night. The left plan delivers 197 of the orders and the right 198.
Because the scenario is planned with the same rules as the real operation, it can’t quietly drop the constraints a spreadsheet model would leave out: the narrow delivery window, the driver’s break, the yard a large lorry can’t get into. Scenario comparison sets out why that matters, and EV transition planning covers the electric case in detail.
Who Does the Work
Strategic questions have been answered in Optrak for years as a modelling exercise: someone who knows the tool, usually a transport planner, builds the scenario, runs it and reports the result. The workbench lets the team that owns the decision do it without waiting for them. They load a spreadsheet of candidate vehicles or a prospective contract’s drops, copy a dataset and change it, run the optimiser, and read the comparison. Four changes are ready to fill in: the fleet, a depot’s position, when drivers work, and how wide a site’s delivery window is. You see every record before and after, and nothing is saved until you say so.
The workbench also has an experimental AI agent window that carries out the same steps from a request typed in plain English. It runs on Anthropic’s Claude and can use only a fixed set of tools. Any change it proposes to your data waits for a person to approve it, and there is a spending limit for each customer.
In Development
Two things are being built and are not yet available. One is a live feed of what actually happened on the road: how long each leg took and how long each vehicle stood at each stop. The other uses that record to learn travel times, time at each stop and energy use from your own history, in place of standard figures. Both would make the daily plan and every scenario more accurate. AI in route optimisation explains where this fits.
Related
- Strategic modelling — each kind of scenario, and how one is built
- The Strategic Workbench — the product, with a worked example of pricing a contract
- The data warehouse — what is kept from every plan, and how to reach it
- Scenario comparison — why a scenario on the real planner can be trusted
- AI in route optimisation — where machine learning fits, and where it does not
Frequently Asked Questions
What is cost to serve?
The cost of making one customer’s deliveries, charged to that customer rather than spread across the operation. It takes in vehicle and driver time, fuel or electricity, distance, and a share of the overheads in proportion to what the customer uses. Carbon cost to serve is the same sum in CO₂. Two customers paying similar amounts can cost very different sums to serve, depending on where they are, how often they order and how narrow their delivery windows are.
Is the strategic model a separate system from the daily planner?
No. A scenario uses the same optimiser, the same sites, vehicles and drivers, and the same rules as the plan the transport office runs each day. The Strategic Workbench is a separate product, but it works on the same data and runs the same optimiser.
Do I need an analyst to run a scenario?
No, though you can have one. Someone who knows the tool can build and run the scenario as a modelling exercise and report back, which is still the better choice for a one-off question or data that needs careful preparation. The workbench lets the team that owns the decision do it themselves.
See Optrak on Your Own Routes
Book a demo and we'll model your fleet, depots and constraints — and show the savings on real data.