Capability
Strategic Modelling
Strategic modelling is the use of route optimisation to test alternative fleet, depot and network configurations before committing capital to them. Optrak runs each configuration through the same optimiser, data model and constraints as the live operation, and compares the results on cost to serve, carbon cost to serve and operational feasibility - so the comparison reflects how the operation would really run, not how a simplified spreadsheet says it would. It can be run as a modelling exercise, set up by someone who knows the tool, or in a self-serve workbench that lets the team owning the decision run it themselves, with an experimental agentic window that drives the steps in plain language.
Last updated: 2026-06-21
What You Can Model
Strategic modelling answers a specific decision, not a general report. The questions operators bring to it come down to a handful of shapes:
- Fleet changes, including EV transition. Run the real schedule of work through a different fleet - swap part of the diesel fleet for electric, HVO or gas, change vehicle sizes, change the mix - and compare cost, emissions and feasibility. The EV case goes deeper: which rounds run on depot charging alone, which need one in-route charge, which still need diesel. EV transition planning covers it on its own.
- Taking on or bidding for new business. Simulate how a prospective contract drops into the existing operation, and read the marginal cost of fitting it in.
- Depot relocation. Model the operation from a different depot and compare total cost and carbon against today’s. This matters most under electrification, where grid capacity for high-power charging is unevenly spread and the best site for a diesel fleet can be a poor one for an EV fleet.
- Shift patterns. Test five-day against six-day working, double-shifting, or a different driver-hours profile, and read the effect on cost, feasibility and the fleet size the work actually needs.
- Service levels. Service level is mostly time-window width. Model tighter or looser windows and see what each level costs to honour - the basis for negotiating it deliberately.
- Uneconomic customers. Cost to serve at customer level surfaces the tail whose cost runs ahead of their contribution - the input to a pricing, service-level or de-prioritisation conversation.
These are the common ones, not the whole list. Carrier-versus-in-house decisions per route, charging-infrastructure profiles and seasonal-condition scenarios all run the same way.
Running a Scenario
Every one of these is a scenario, and they all run the same way. Take the live operation, change the one thing the decision turns on, run the optimiser again, and compare the result against today’s plan. The engine, the data model and the constraints are the ones that produce the daily plan, so the comparison carries the weight of a live plan rather than a separate spreadsheet model built alongside it.
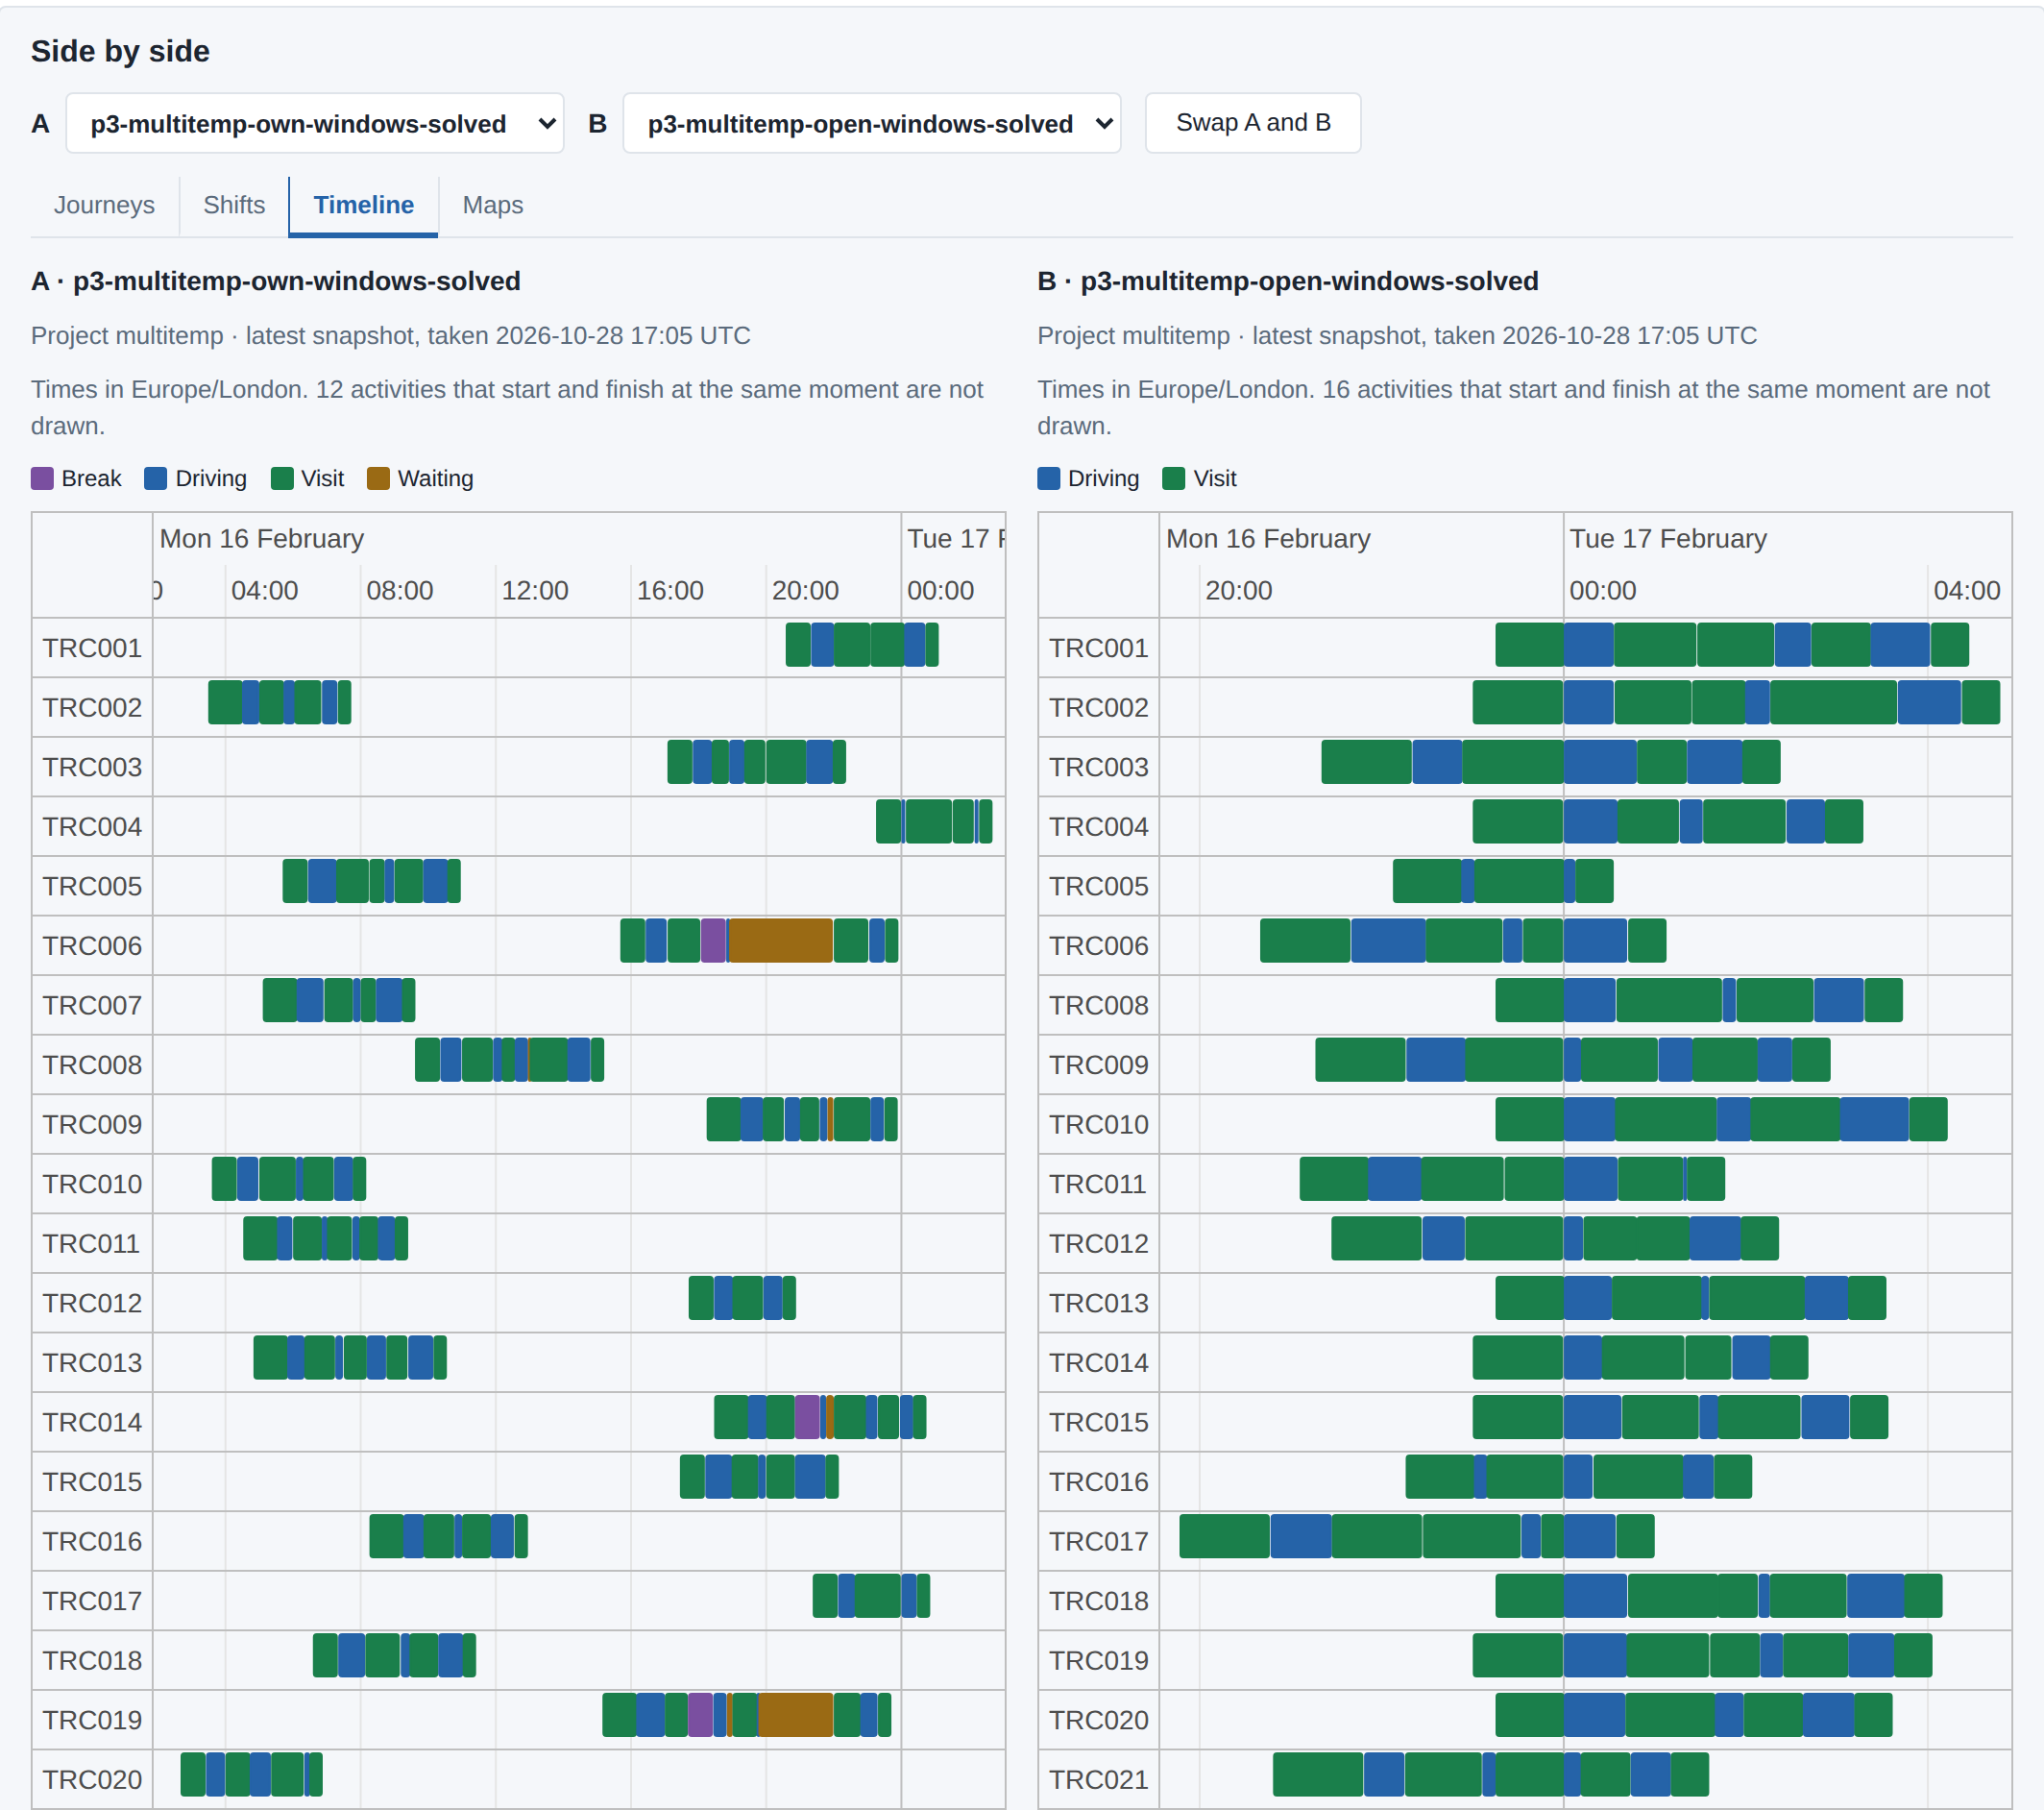
The same 208 orders planned twice, side by side, with the first twenty lorries of each plan shown. Each row is one lorry’s day: blue is driving, green is time at a stop, brown is waiting and purple is a break. On the left, every customer keeps its own delivery window. The 41 lorries go out at any time from 02:26 to 23:15, and 13 of them wait for a window to open, 21 hours in all. On the right, every window is opened to the whole planning day, 03:00 on Monday to 05:00 on Tuesday, and all 40 lorries go out between 19:46 and 23:15 and are back by 04:47, with no waiting. The two sides are drawn to different scales: the left covers all of Monday, the right only Monday evening and the night. The left plan delivers 197 of the orders and the right 198.
There are two ways to do the work. The established way is a modelling exercise: someone who knows the tool builds the scenario, runs it, and reads the result back to whoever asked. This is how strategic questions have been answered at Optrak for years, and it is still the right route when the question is one-off or the data needs careful setup.
The Optrak Strategic Workbench is the newer way, and a product in its own right. It lets the team that owns the decision do the work themselves - import their own data, clone and adjust a dataset, run the production optimiser, and read the comparison side by side. The difference is access. A finance director after a number on fleet reduction, a bid team that needs a marginal cost by Friday, a planner testing a depot move - none of them has to wait for the operational user - typically a transport planner - to be allocated to the project. The question gets answered, instead of being settled on a spreadsheet.
The workbench also has an experimental agentic window that carries those same steps from a plain-language request. It drives a fixed set of safe tools, every change it proposes is put to a person before it runs, and a budget caps what it can spend. The tools allow querying the data warehouse, modifying data and running the optimiser.
Why It Runs on the Operational Planner
Most operators keep two views of their fleet. A planning team runs the day-to-day optimiser; a strategy or supply-chain team runs spreadsheets and consultancies for the big decisions. The two drift apart. The strategic models simplify away constraints the operation learned long ago, and the operational team’s hard-won knowledge never reaches the strategic model. Those simplifications are exactly where a strategic decision surprises everyone on first contact with operations - the depot move that modelled a saving but adds cost because the new geography breaks two profitable rounds.
Running the analysis on the same platform that runs daily planning closes the gap. A scenario uses the same network, vehicle definitions, time windows and driver rules as the live operation, and it moves with them when they change. Scenario comparison makes the full case; the short version is that the comparison reflects how the operation would actually run, and the strategic team gets an answer in days rather than months.
The Data Warehouse, and What It Could Learn
Every plan an operator runs leaves a record: how long each leg actually took, how long a vehicle actually sat at each customer, how much energy it actually used. Held in one place across the operation, that record is a data warehouse - every plan captured and fully queryable, which is what the comparison and pivot views draw on today.
The next step, in active development rather than shipped, is to let machine learning mine that record to sharpen the inputs the optimiser depends on: travel time by road segment and time of day, dwell and service time per customer, energy use per vehicle type and route profile. This matters because a scenario comparison is only as good as the assumptions under it. When travel, dwell, service and consumption come from the operation’s own history rather than from generic defaults, both the daily plan and the what-if scenario get more accurate. What is still missing is a live feed of those actual times - Optrak’s real-time capability, also in development - for the learning to draw on; the machine learning would then feed the optimiser better numbers without replacing it. This is the performance prediction strand of AI in route optimisation.
What a Good Strategic Question Looks Like
A good strategic question is specific, and phrased in operational terms. “Should we lease 3 more electric 18t trucks for the southern depot in Q1, given expected demand and the charging we have?” is the kind of question the strategic mode is built to answer. The output is a comparison of cost, emissions and feasibility under stated assumptions, with the assumptions written down so they can be argued with.
What It Doesn’t Replace
Strategic analysis built on route simulation is strong where the constraints are well defined and the data exists. It is weaker on pure forecasting - whether the customer base will shift in a given direction over the next five years - and on capital-structure questions like lease versus buy or the depreciation profile of EV assets against diesel. For those, the route simulation is an input to a wider analysis rather than the analysis itself.
In This Section
- The Agentic Window: Drive the Workbench in Plain Language (Experimental) An experimental AI agent inside the strategic workbench that turns a plain-language request into calls on a closed set of tools: query the data warehouse, import a spreadsheet, clone and adjust a dataset, run the optimiser, compare snapshots. Every change is approved by a person before it runs, and a per-customer budget caps the spend. No language model produces a route, sets an optimisation parameter or evaluates a cost.
- The Data Warehouse: The Queryable Record of Every Plan Every plan an operation runs is captured in one place and kept queryable: datasets, optimised snapshots, and route-level detail. It is what the strategic workbench compares and pivots over, and the record the AI agent reads in plain language. Direct database access is not granted, for security; a PostgreSQL dump can be supplied for your own systems.
- Scenario Comparison: What-If Analysis Against the Operational Data Model Run alternative fleet, depot, contract or schedule configurations through the same optimiser that produces your daily plans, and compare them on cost, CO₂, feasibility, vehicle utilisation and driver hours. Same data model, same constraints, same optimiser as live planning, so the comparison is operationally credible rather than a spreadsheet abstraction.
- EV Transition Planning: Sorting Your Real Schedule of Work by What an EV Could Do How Optrak sorts your existing rounds by what an EV could do with them: the schedule you already run, put through the optimiser that builds your daily plans against a candidate electric fleet, with physics-based consumption and in-route charging. Run as a modelling engagement or self-serve in the strategic workbench.
Frequently Asked Questions
What is cost to serve?
Cost to serve is the total cost of fulfilling a customer’s deliveries, allocated to that customer rather than spread across the operation as overhead. It includes vehicle and driver cost, fuel or energy, distance and time, and overhead allocated by the share of resource the customer consumes. Carbon cost to serve is the same calculation expressed in CO2 emissions rather than money.
Why is cost to serve a strategic question rather than just a financial one?
Because once you know the cost to serve a customer, you can make better decisions about pricing, service levels, and which customers to actively pursue or de-prioritise. Two customers with similar revenue can have very different costs to serve depending on their location, drop pattern, time windows, and product handling requirements. Strategic decisions made without this visibility tend to overweight revenue and underweight true contribution.
How does Optrak help evaluate fleet electrification?
By running the operator’s actual schedule of work through alternative fleet compositions and reporting on feasibility, cost, and emissions. The right question is not ‘can we run EVs’ but ‘of our current rounds, which can be served by EVs with depot charging only, which can be served with one in-route charge, which still need diesel or another fuel.’ Sorting the rounds that way determines the realistic transition path and the infrastructure investment it implies. See EV transition planning.
What about depot relocation analysis?
Optrak can simulate operations from a hypothetical depot location and compare total cost and carbon cost against the current depot. This is most useful when assessing whether to consolidate depots, open a new one closer to a customer cluster, or relocate to take advantage of grid capacity for EV charging.
Can Optrak help with new contract bidding?
Yes. By simulating how a prospective new contract would integrate into the existing operation, Optrak produces a marginal cost figure that supports pricing decisions. This avoids the common error of pricing new work against average cost to serve when its actual marginal cost, given existing routes, vehicles and depot capacity, may be substantially different.
Do I need to be an optimisation specialist to run a scenario?
Not necessarily. A scenario can be run as a modelling exercise, set up by someone who knows the tool and read back to the decision-maker. The self-serve strategic workbench takes that dependency away: it lets the team that owns the decision import data, clone and adjust a dataset, run the optimiser and compare the results themselves. It also includes an experimental AI agent window that drives those steps in plain language, and is deliberately limited - a closed toolset, a person’s approval on every change, and a per-customer budget.
See Optrak on Your Own Routes
Book a demo and we'll model your fleet, depots and constraints — and show the savings on real data.