data model
EV Modelling
Optrak works out how much charge an electric lorry will use on each stretch of a round — from the vehicle itself, what it is still carrying at that point, the hills, the traffic and the weather — rather than giving every vehicle a single range figure and hoping. That is the difference between using an electric vehicle for what it can really do and keeping it on short local work to be safe.
Last updated: 2026-08-11
Key Capabilities
- Energy use worked out stretch by stretch from weight, hills, air resistance, traffic, and the energy recovered when braking
- Weather allowed for: cold weather on the battery and on in-cab heating, wind on air resistance
- Energy figures prepared in the same step as distances and journey times, so the optimiser has them while it plans
- How much charge is left is checked as the round is built — a round that would run the battery below your safety margin is never produced
Why One Range Figure per Vehicle Doesn’t Work
Most routing software treats an electric vehicle’s range as a single number — one figure per vehicle, applied to every round. But what a vehicle actually uses per kilometre can vary by a factor of two, depending on what it is carrying at the time, the hills, the traffic and the weather.
Without a proper estimate, there is no safe way to set that number, and both ways of getting it wrong cost money. Set it cautiously and the electric vehicles get kept to short local rounds, well inside what they can do — which is the wrong way round, because their running cost per kilometre is the low one. Every kilometre they don’t do is a kilometre done on diesel, at diesel prices and with the CO2 that goes with it. Set it optimistically and a vehicle stops short with a load still on board, and somebody has to go and recover it — a day’s work lost and a customer let down.
The place worth getting to is the one in between: electric vehicles working rounds that go close to what the battery can do, so those kilometres are done on electricity rather than diesel. That needs an estimate you can rely on.
How Optrak Works It Out
From the Physics
Optrak works out the energy for each stretch of road from the physical facts: how much the vehicle weighs at that point in the round, the hills, air resistance, and rolling resistance, less whatever is recovered when it brakes.
The method comes from research at Cambridge University Engineering Department (Madhusudhanan, Na, Cebon, Energies 2021), carried out under the Centre for Sustainable Road Freight — the industry and academic group Optrak is a member of.
Traffic
Road speeds vary through the day, and that matters more for energy than it first appears. If traffic simply moved more slowly but steadily, it would use less energy. Real congestion isn’t like that: it is stop, start, speed up, slow down, and all that accelerating and braking uses more. Optrak allows for this by comparing the expected speed with the free-running speed on that road at night — the further below it the traffic is, the more energy is assumed. It is an approximation, and Optrak is following current research to sharpen it.
Because journey times already vary by time of day, the time a vehicle sets off feeds straight into the energy estimate.
Weather
The day’s weather adjusts the figures. Cold weather takes something off what the battery will give and adds the in-cab heating on top of it; wind changes how hard the vehicle has to push through the air. For a round with plenty of charge in hand these are small corrections. For winter work, exposed routes, or anything close to the limit, they decide whether the plan works at all.
Charging at the Depot
Coming back to the depot allows a charge mid-shift — a full one, or more often a partial one. That is what makes a second trip out possible, whole or in part.
Charging on the Road
You can nominate places to charge away from the depot — either from a supplied list or ones of your own, such as a site belonging to a company you work with. Where those exist and the charge runs low, the optimiser can put a charging stop into the round. See in-route charging for how it decides.
Into the Optimiser
For battery electric vehicles, the charge left on the vehicle is checked in exactly the same breath as everything else — delivery windows, what fits on the vehicle, who is allowed to drive it. Every change the optimiser considers is checked against it, so a round that would take the battery below the safety margin you have set is never produced in the first place.
The Same Round on a Heavy Day
A regional distributor runs an electric HGV with 250 kWh usable. Four stops, around 180 km, in hilly country.
Going by the range figure: published range is around 230 km, the round is 180, so it fits. It gets scheduled as one trip.
What Optrak sees: in the morning the vehicle is loaded for all four stops. The first climb, at full weight, takes more out of the battery than the range figure implies. By the third stop it is still carrying a good deal of weight over a second climb, and the charge left at the end of the round comes out below the safety margin. Optrak sees that while it is building the round, not afterwards. It either changes the order of calling to get the heaviest goods off first — so the hard climbs are done lighter — or it puts in a charging stop, costed against the alternatives. On a lighter day the same round might need neither.
Software that doesn’t model the variation has to pick one error or the other: waste the vehicle, or strand it. There is no neutral default.
How This Compares
The better standalone electric-vehicle route planners are credible products: they allow for the load, they allow for weather, and they hold large libraries of vehicle data. Some of their marketing takes aim at tools that work off a single range figure. Optrak agrees with them about that.
The difference is where it sits. A standalone planner is a separate exercise — the round gets built first, then checked. Optrak works out the energy figures in the same preparation step as distances and journey times, so energy is there from the start of building. The optimiser needs no special electric-vehicle logic: it asks for energy exactly as it asks for distance or journey time, and the charge is checked as the round is built rather than confirmed afterwards.
A good deal of routing and transport software has less developed electric-vehicle modelling than this at the time of writing — weight-aware fuel figures for diesel, for instance, rather than energy worked out from the physics for electric.
Technical Detail
The original model is based on four energy components: acceleration — kinetic energy, proportional to mass × v². Drag, proportional to v² × distance. Rolling resistance, proportional to mass × distance. Gradient, proportional to mass × elevation change. Regenerative braking returns kinetic and potential energy to the battery.
The computationally efficient (CE) framework decomposes per-leg consumption into a drive-cycle vector (speed profile, elevation, timing) multiplied by a vehicle parameter vector (mass, drag, rolling resistance). Drive-cycle vectors for typical legs are precomputed; per-vehicle consumption is then a vector multiplication.
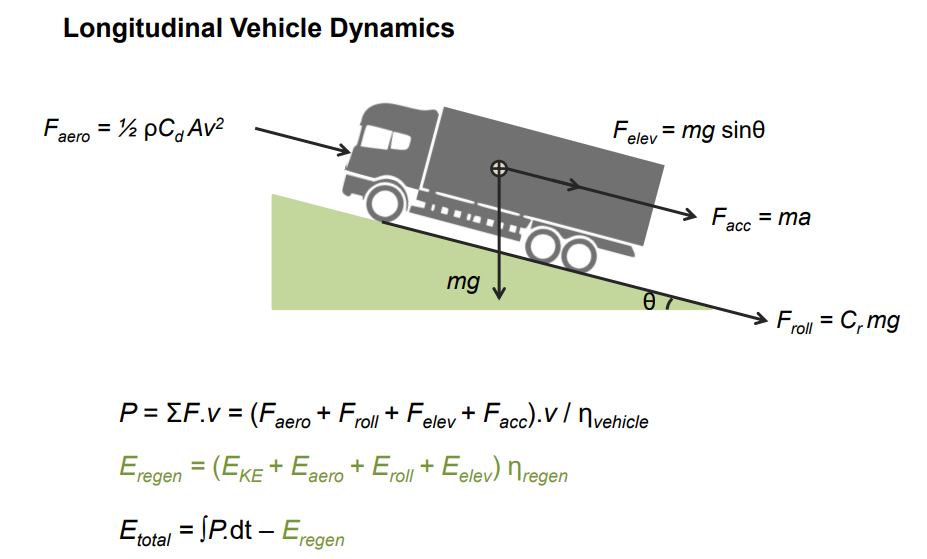
Longitudinal vehicle dynamics: the force components and energy equations behind per-leg consumption. Diagram: P. Deshpande et al., 2023. Equations: A. K. Madhusudhanan et al., 2021.
Frequently Asked Questions
How does Optrak work out what an electric vehicle will use?
Stretch by stretch, from the physics: how much the vehicle weighs at that point, air resistance, rolling resistance, the speeds and hills on the way, when it sets off, and the weather. The method comes from research at Cambridge University Engineering Department under the Centre for Sustainable Road Freight (Madhusudhanan, Na, Cebon, Energies 2021). The figures are worked out in the same preparation step as distances and journey times, and Optrak uses them the same way.
Does what the vehicle is carrying make a difference?
Yes, and it is one of the biggest factors. Weight is worked out for each stretch as the vehicle actually is at that point — the empty weight plus whatever is still on board after the drops it has already made. So the same stretch of road costs less charge later in the round than it does at the start, and the optimiser can prefer an order of calling that gets the heaviest goods off before a long climb or a fast stretch of motorway.
How is weather handled?
The day’s weather adjusts the figures. Cold weather takes something off the battery and adds the in-cab heating on top. Wind changes how hard the vehicle has to push through the air. For a round with plenty of charge in hand these are small corrections. For winter work, exposed routes, or anything close to the limit, they decide whether the plan works at all.
Can Optrak plan a charging stop into a round?
Yes. Charge is one of the things checked as the round is built, and where it runs short, specialist methods place a charging stop — weighing what electricity costs at that spot, the time the stop takes, and how much charge the stretches either side of it will use. See in-route charging for the detail.
How is this different from a separate electric-vehicle route planner?
The better standalone electric-vehicle planners are credible, mature products — they allow for what the vehicle is carrying, they allow for weather, and they hold large libraries of vehicle data. The difference is where the work happens. A standalone planner checks whether a round is possible after the main system has already built it. Optrak works out the energy figures in the same step as distances and journey times, so the optimiser has them from the moment it starts building.
Why isn’t a single range figure enough?
Because what a vehicle uses per kilometre varies by a factor of two or more across ordinary conditions — what it is carrying, the terrain, the traffic, the temperature. One figure per vehicle either wastes the vehicle, by insisting on charging stops it doesn’t need, or strands it, by sending it on a round it can’t finish.
Related
Technical Summary
EV energy consumption is computed per leg from mass, drive cycle (speed profile, elevation), start time, and weather. The methodology is the computationally efficient framework developed at Cambridge University Engineering Department by Madhusudhanan, Na, and Cebon under the Centre for Sustainable Road Freight programme, which decomposes per-leg consumption into a drive-cycle vector multiplied by a vehicle parameter vector. Per-leg compute is around 20 ms. Consumption is represented as a surface over start time and current mass, refined by daily weather. Congestion is captured by a night-time-speed heuristic that distinguishes stop/start (energy-intensive) from steady-state slower flow (energy-saving). Regenerative braking is modelled at battery-pack round-trip efficiency. Consumption matrices are produced alongside distance and time matrices; the optimiser queries them as a first-class data input. State-of-charge is a hard constraint during route construction. The architectural distinction from a standalone EV route planner is that consumption is integrated at the data layer rather than evaluated as a post-construction scenario.
Reference: Madhusudhanan, A.K.; Na, X.; Cebon, D. (2021). “A Computationally Efficient Framework for Modelling Energy Consumption of ICE and Electric Vehicles.” Energies 14(7), 2031. DOI: 10.3390/en14072031. Funded by EPSRC Grant EP/R035199/1, Centre for Sustainable Road Freight 2018–2023.
See Optrak on Your Own Routes
Book a demo and we'll model your fleet, depots and constraints — and show the savings on real data.